flowchart TD
  A[1. Import data, event markers, channel locations into EEGLAB] --> B[2. Down-sample EEG data to 256 Hz]
  B --> C[3. Apply Finite Impulse Response filter: 1-40 Hz ]
  C --> D[4. Remove non-relevant channels - EOG, Mastoids]
  D --> E[5. Manually remove channels with uncommonly high or low power]
  E --> F[6. Re-reference data to common average]
 F --> G[7. Interpolate removed electrodes, using spherical interpolation]
Sleep restriction affects vigilant attention:
Behavioural and neural correlates
Talk information
- This talk was written in Quarto (R Markdown/R Studio) & is available online
Stages of sleep
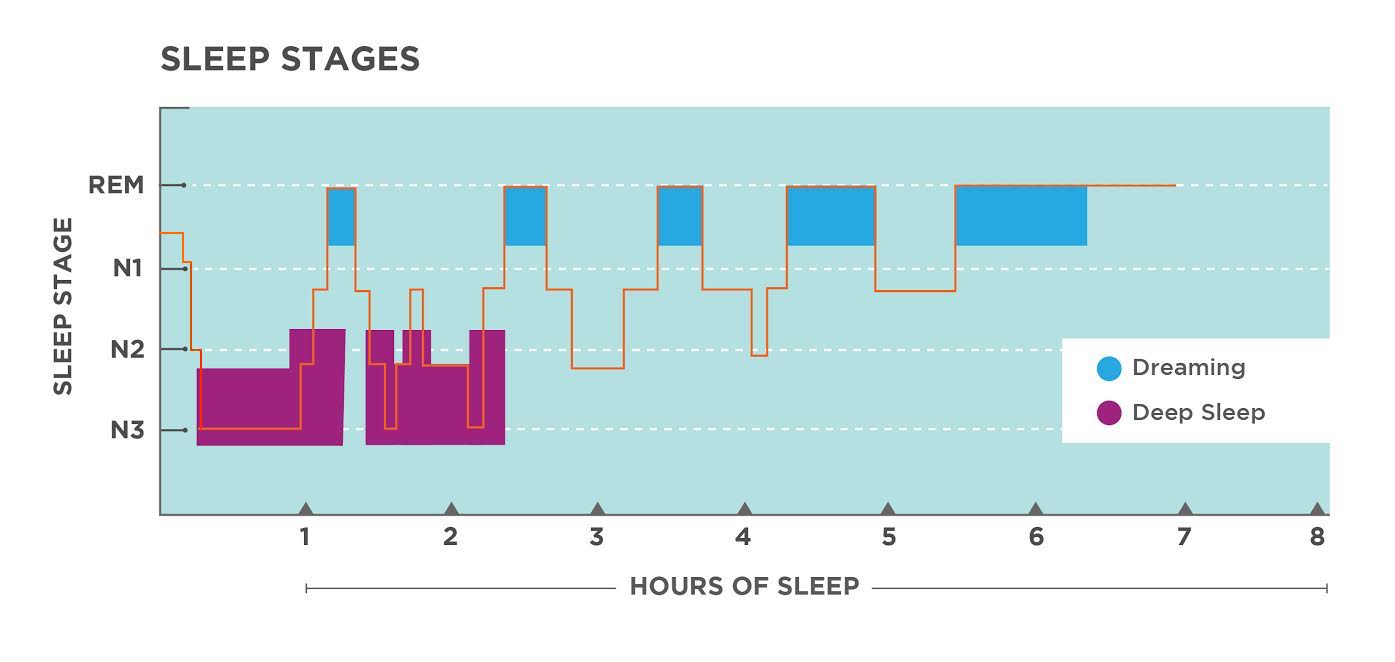
- Staging sleep involves classifying the EEG signal, often still by hand
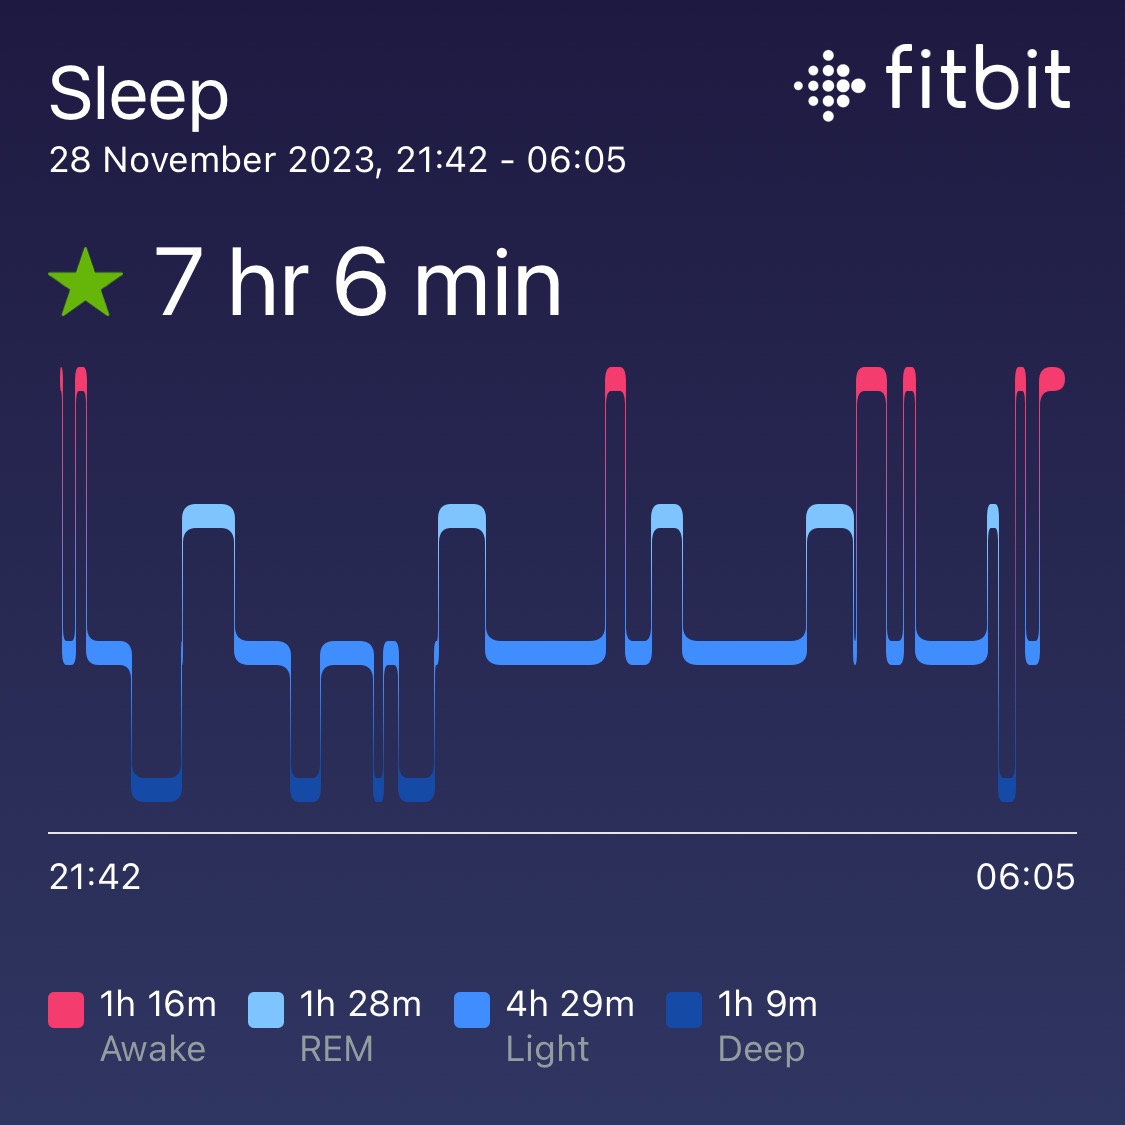
- Modern wearable technology enables much easier sleep tracking
- Accuracy not as good as polysomnography, but improving
- Enables inexpensive in-home sleep assessments
- Big data?
- Also relatively cheap
Sleep restriction vs. sleep deprivation
- Much research looks at total sleep deprivation (no sleep overnight)
- Profound effects on cognition (memory, attention, etc)
- But sleep restriction (less sleep than usual) is much more common
- Effects on cognition not as well researched
- But this type of sleep loss is much more common!
Background
- These data were originally collected in 2015 as part of an Honours project by Lucienne Shenfield at ANU
- Now working as a clinical psychologist specialising in sleep
- Some of this work is now published
- What we’ll mainly talk about is the work of another Honours student Lourdes Machin (UNE, 2022)
- Lourdes analysed the during-task EEG data for the Psychomotor Vigilance Task


Sleep restriction
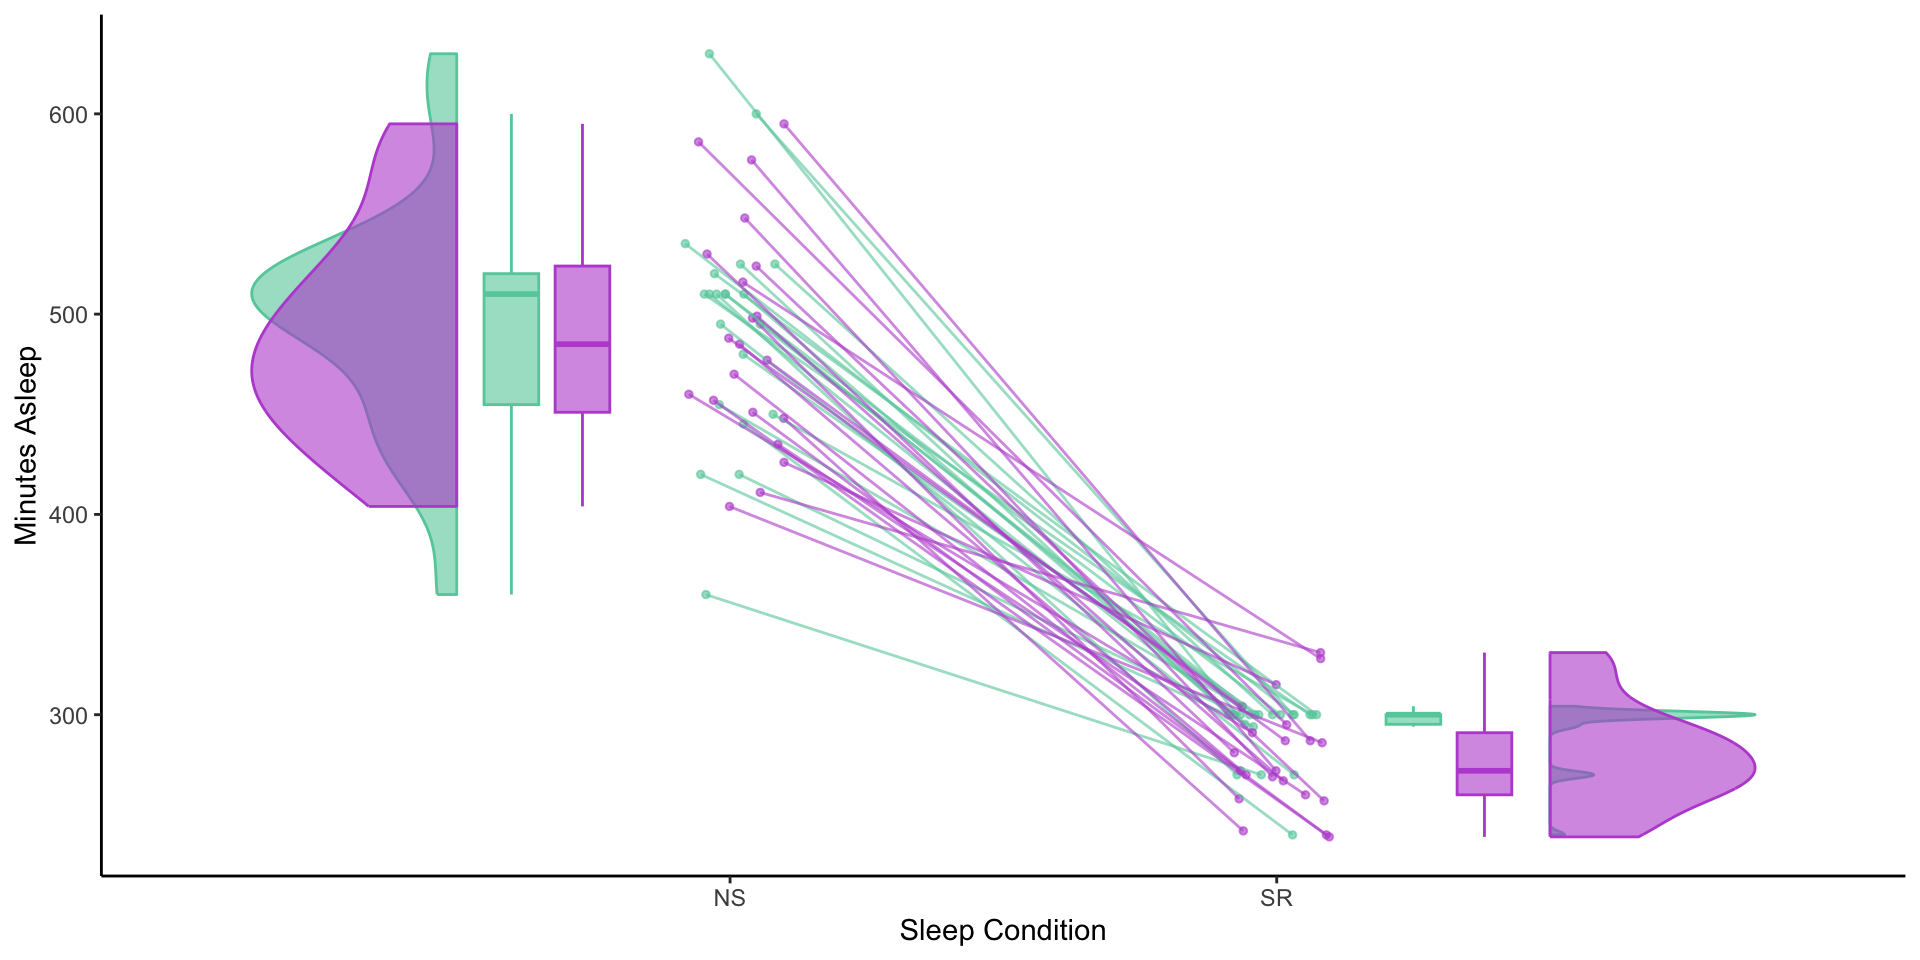
Minutes of Sleep: Diary and FitBit
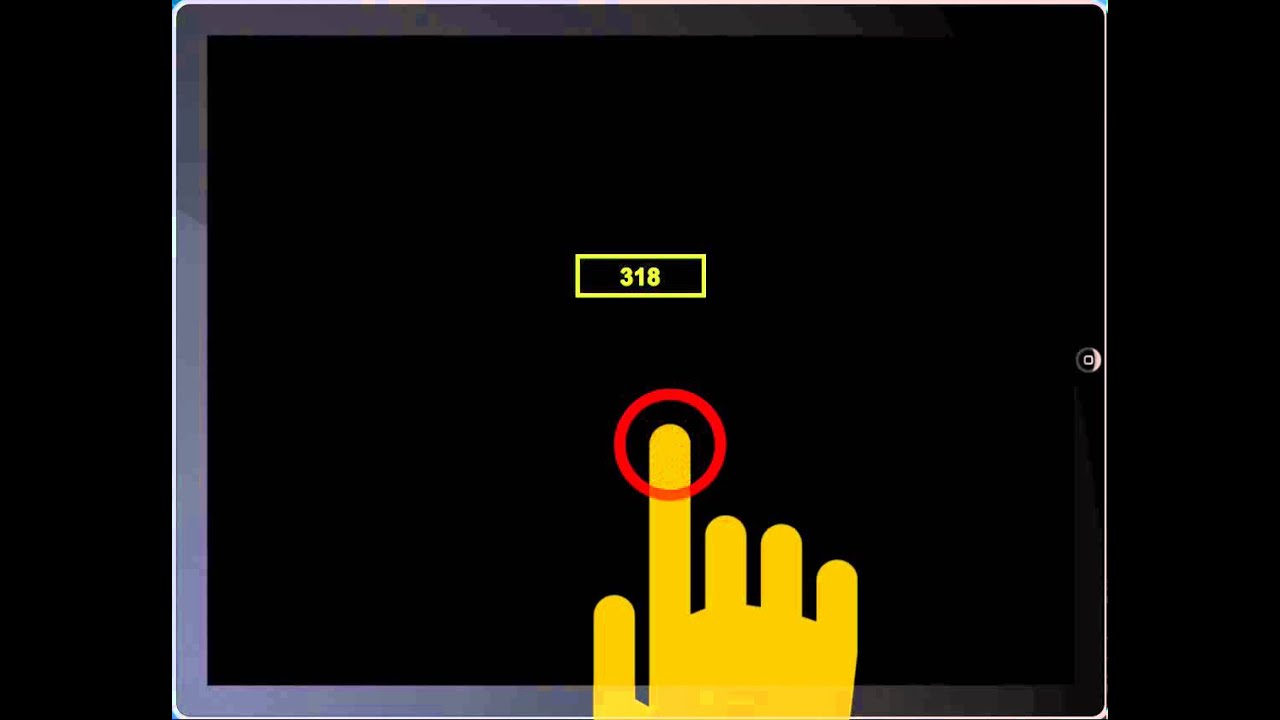
Task: Psychomotor Vigilance Task
- 10 minutes long
- Participants press a button as soon as they see red numbers appear
- Numbers appear at random intervals (2-10s apart)
- Reaction time (ms) is measured
- Also lapses (>500ms), false starts (<100ms)
- ~80 trials per session
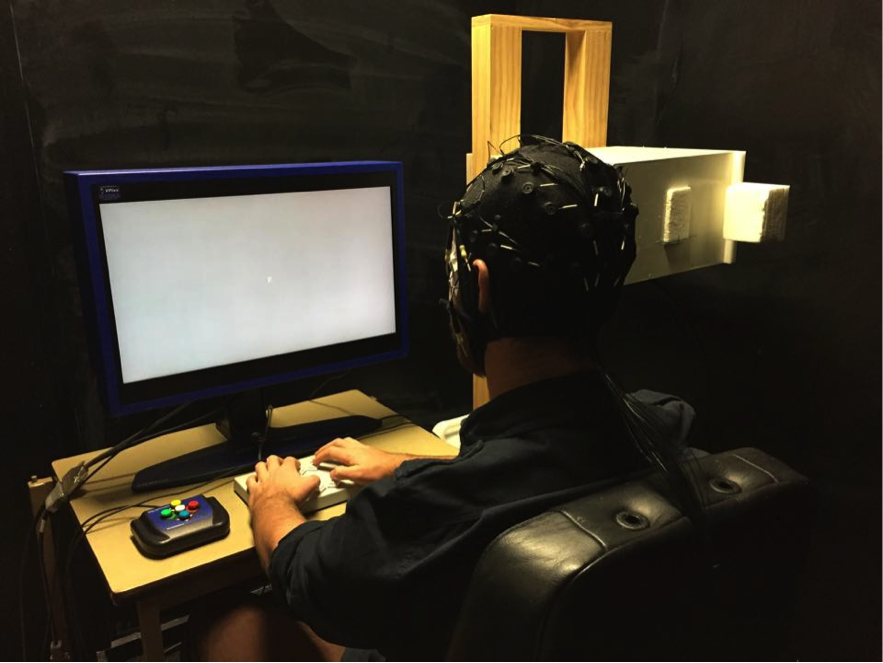
EEG
- Compumedics NuAmps 32-channel EEG system
- Electrodes 10/20 system
- Electrode maximum impedance: 5 \(k\Omega\)
- Signal recorded at 1000 Hz
- NuAmps digital amplifier
- Curry 7.0.9 software
- Resting state and during-task recording
Behavioural data
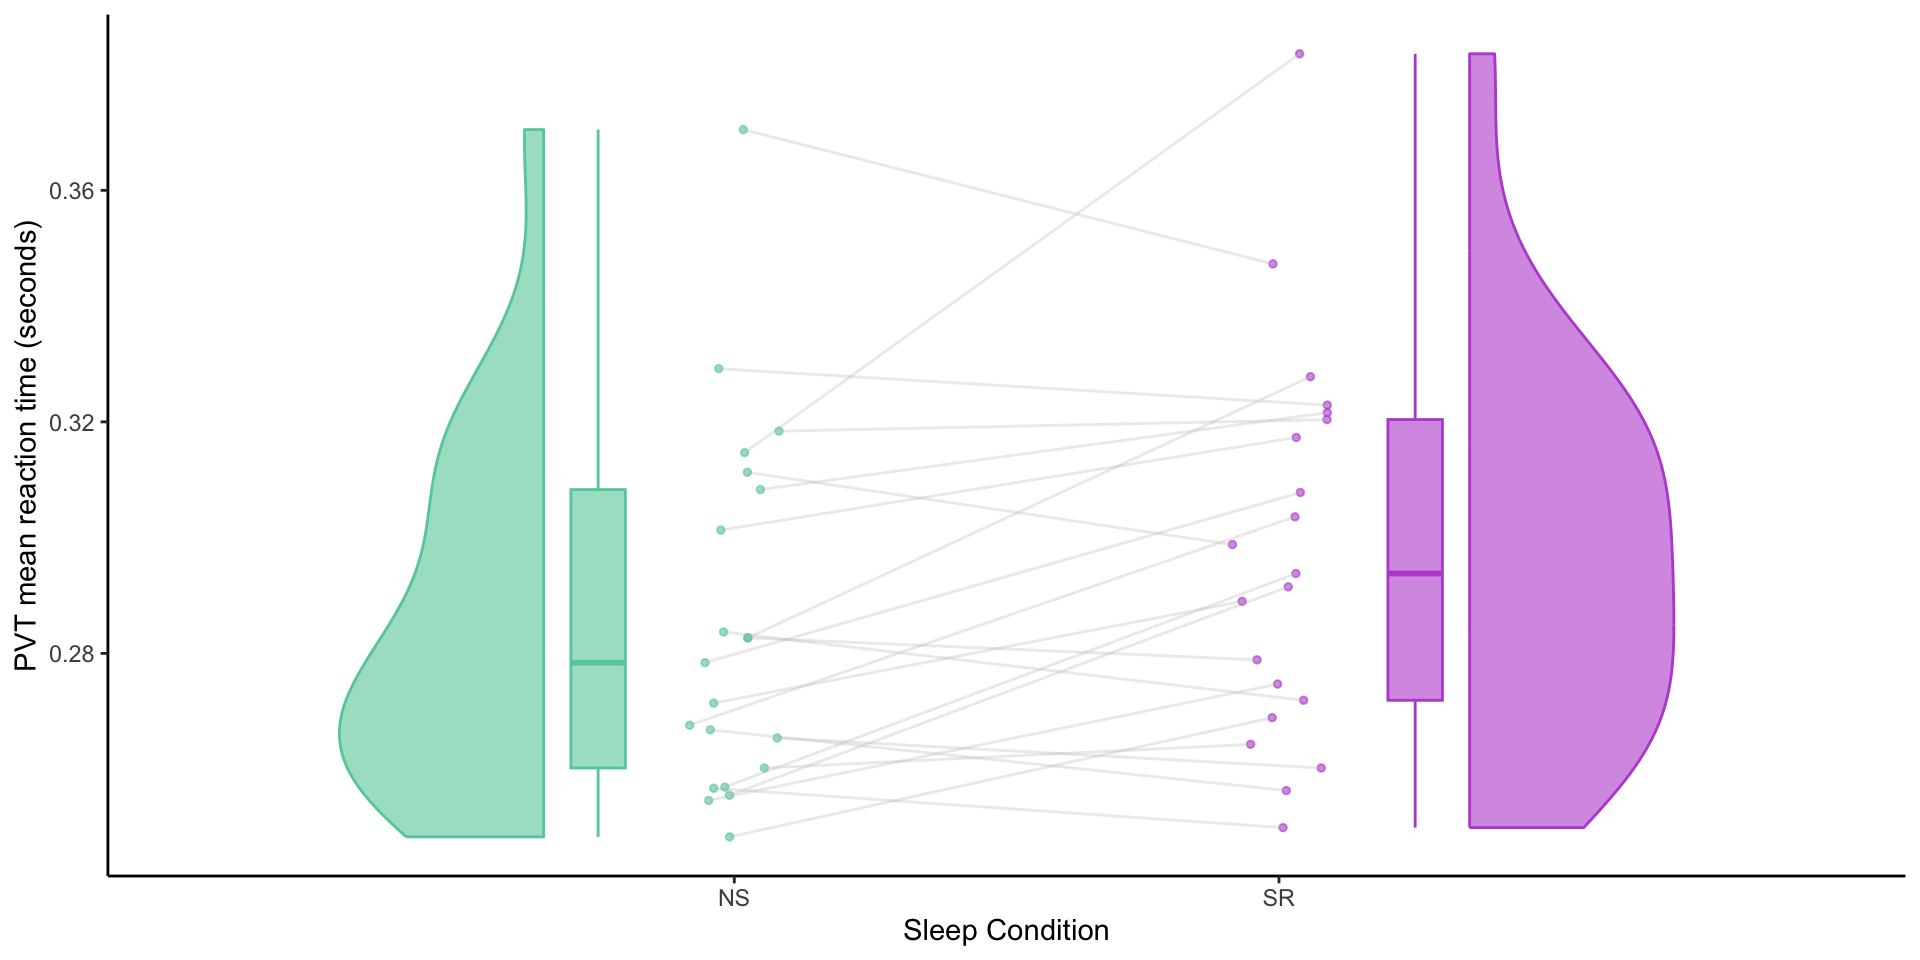
Mean reaction times by sleep condition
Subjective sleepiness
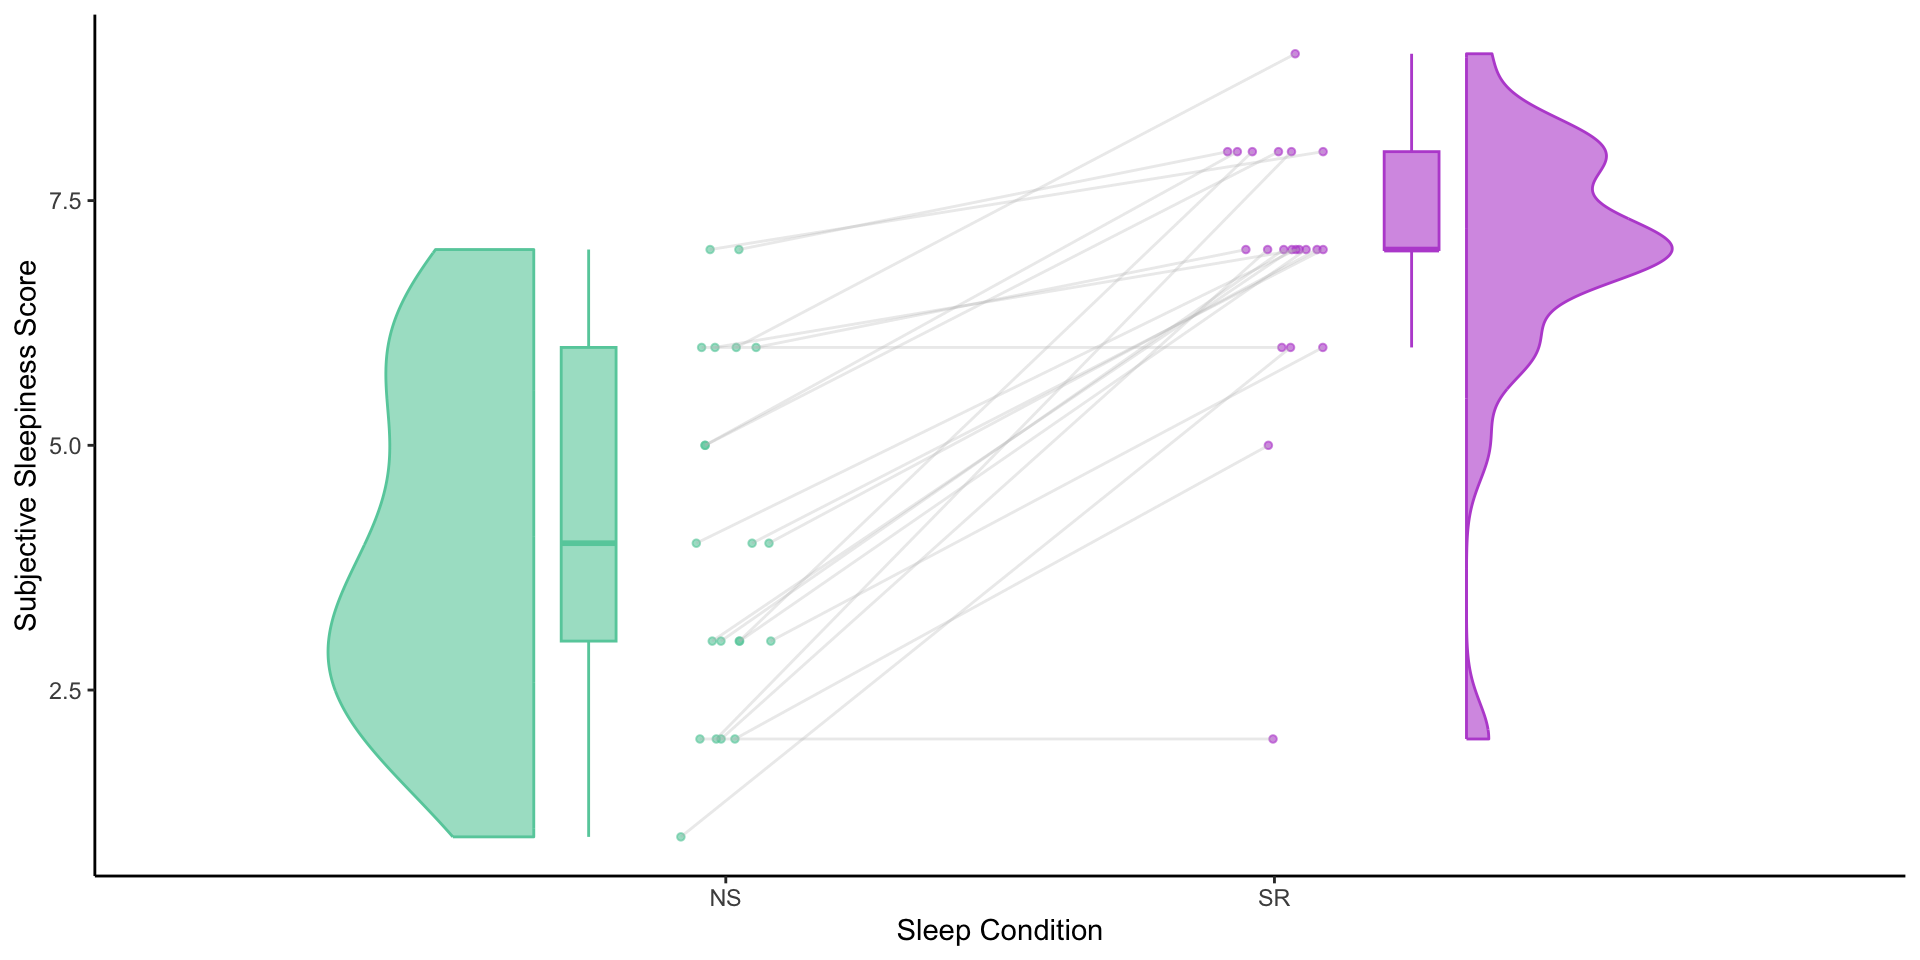
Mean Karolinska Sleepiness Scale scores by sleep condition
ERP data
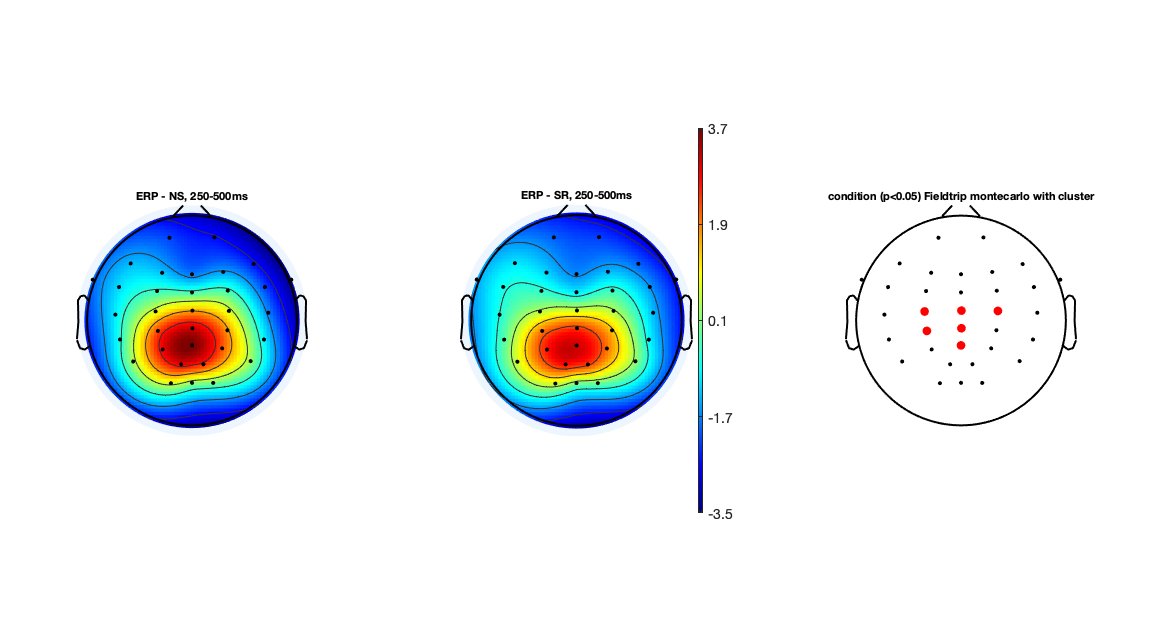
ERP amplitude differences: ERP Topographic Maps 250-500 ms
ERP data - differences - Pz
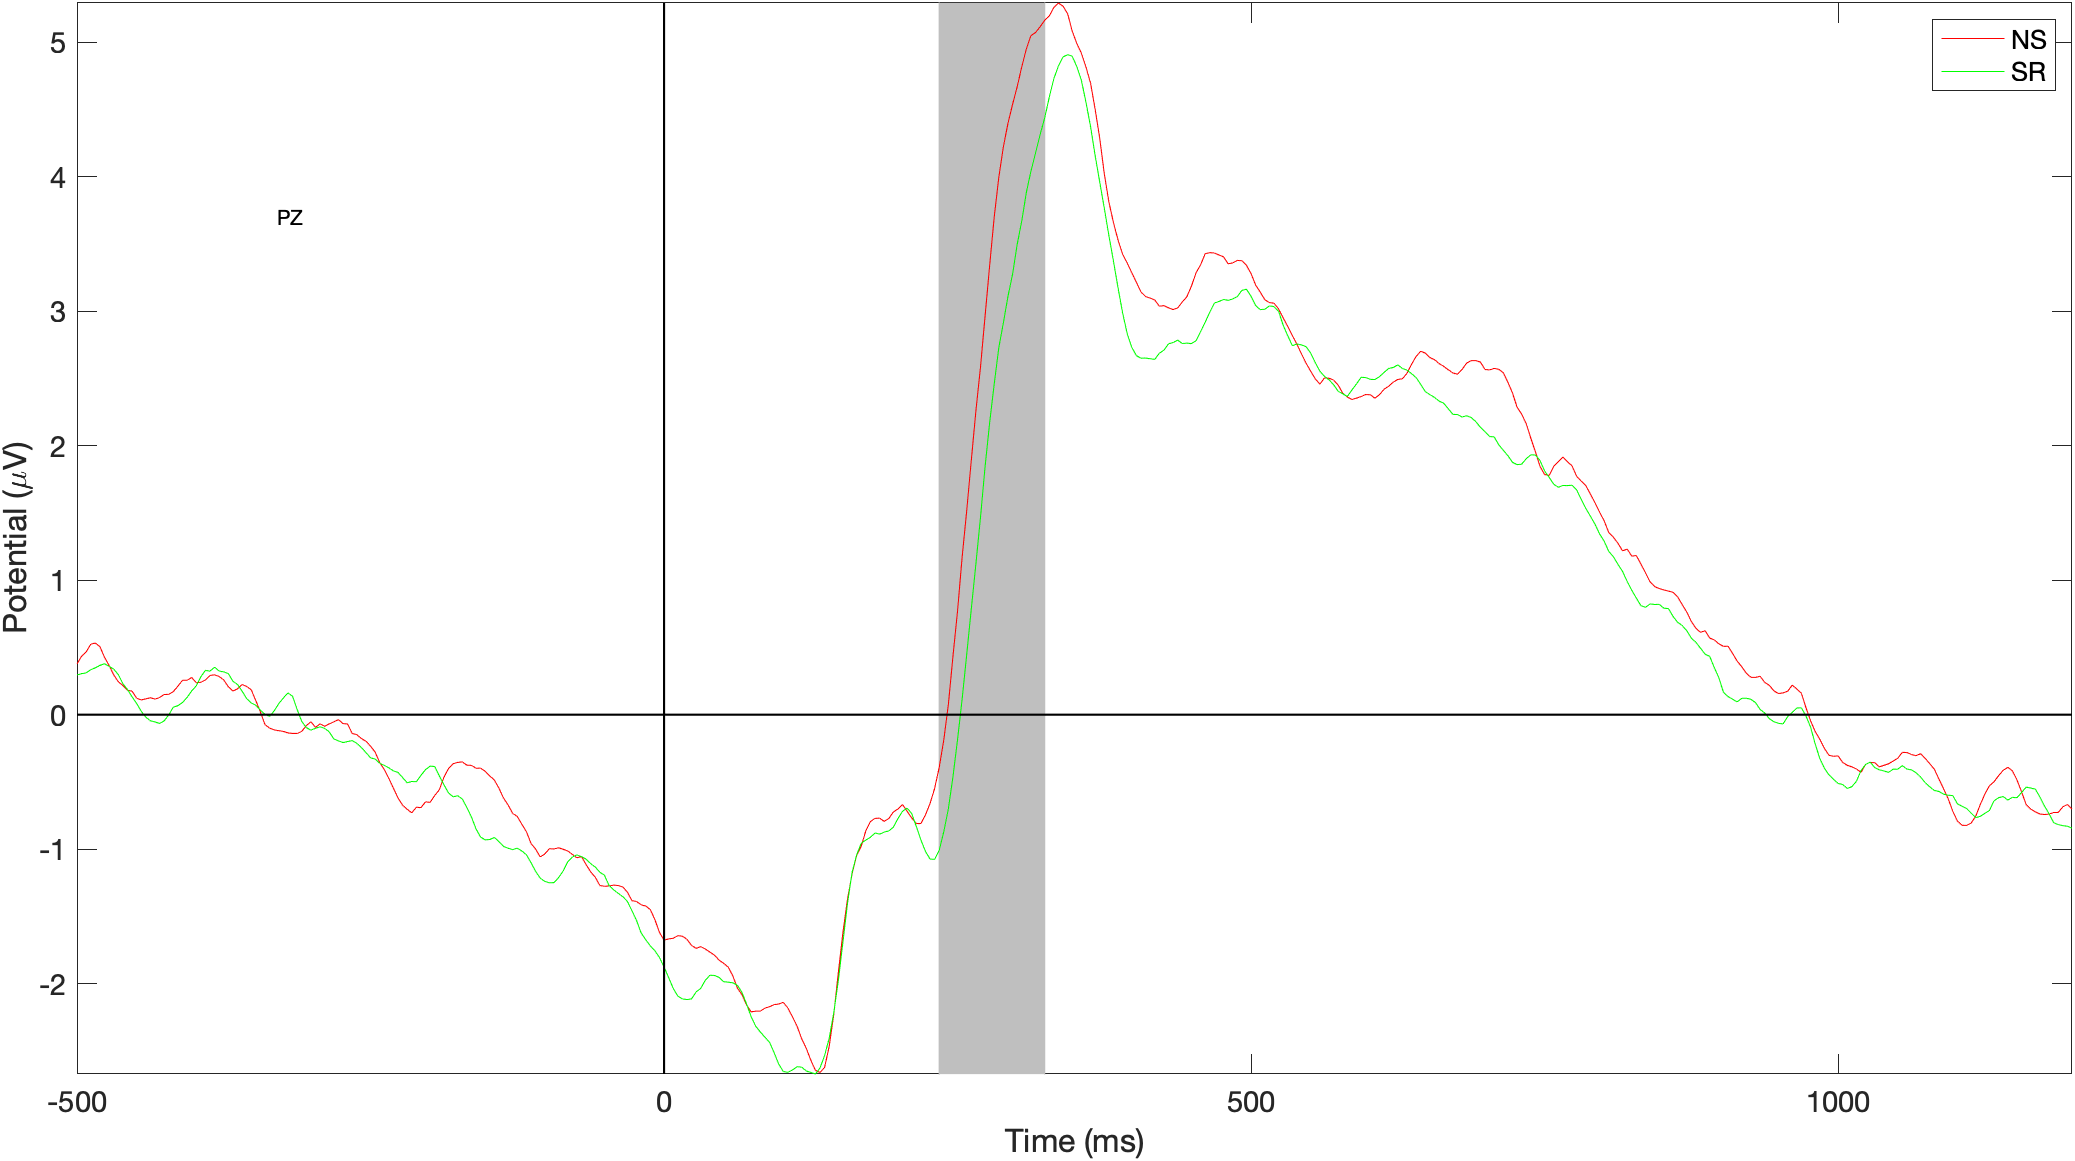
Grey bar shows statistically significant differences in amplitude at the start of P3
ERP data - differences - CPz
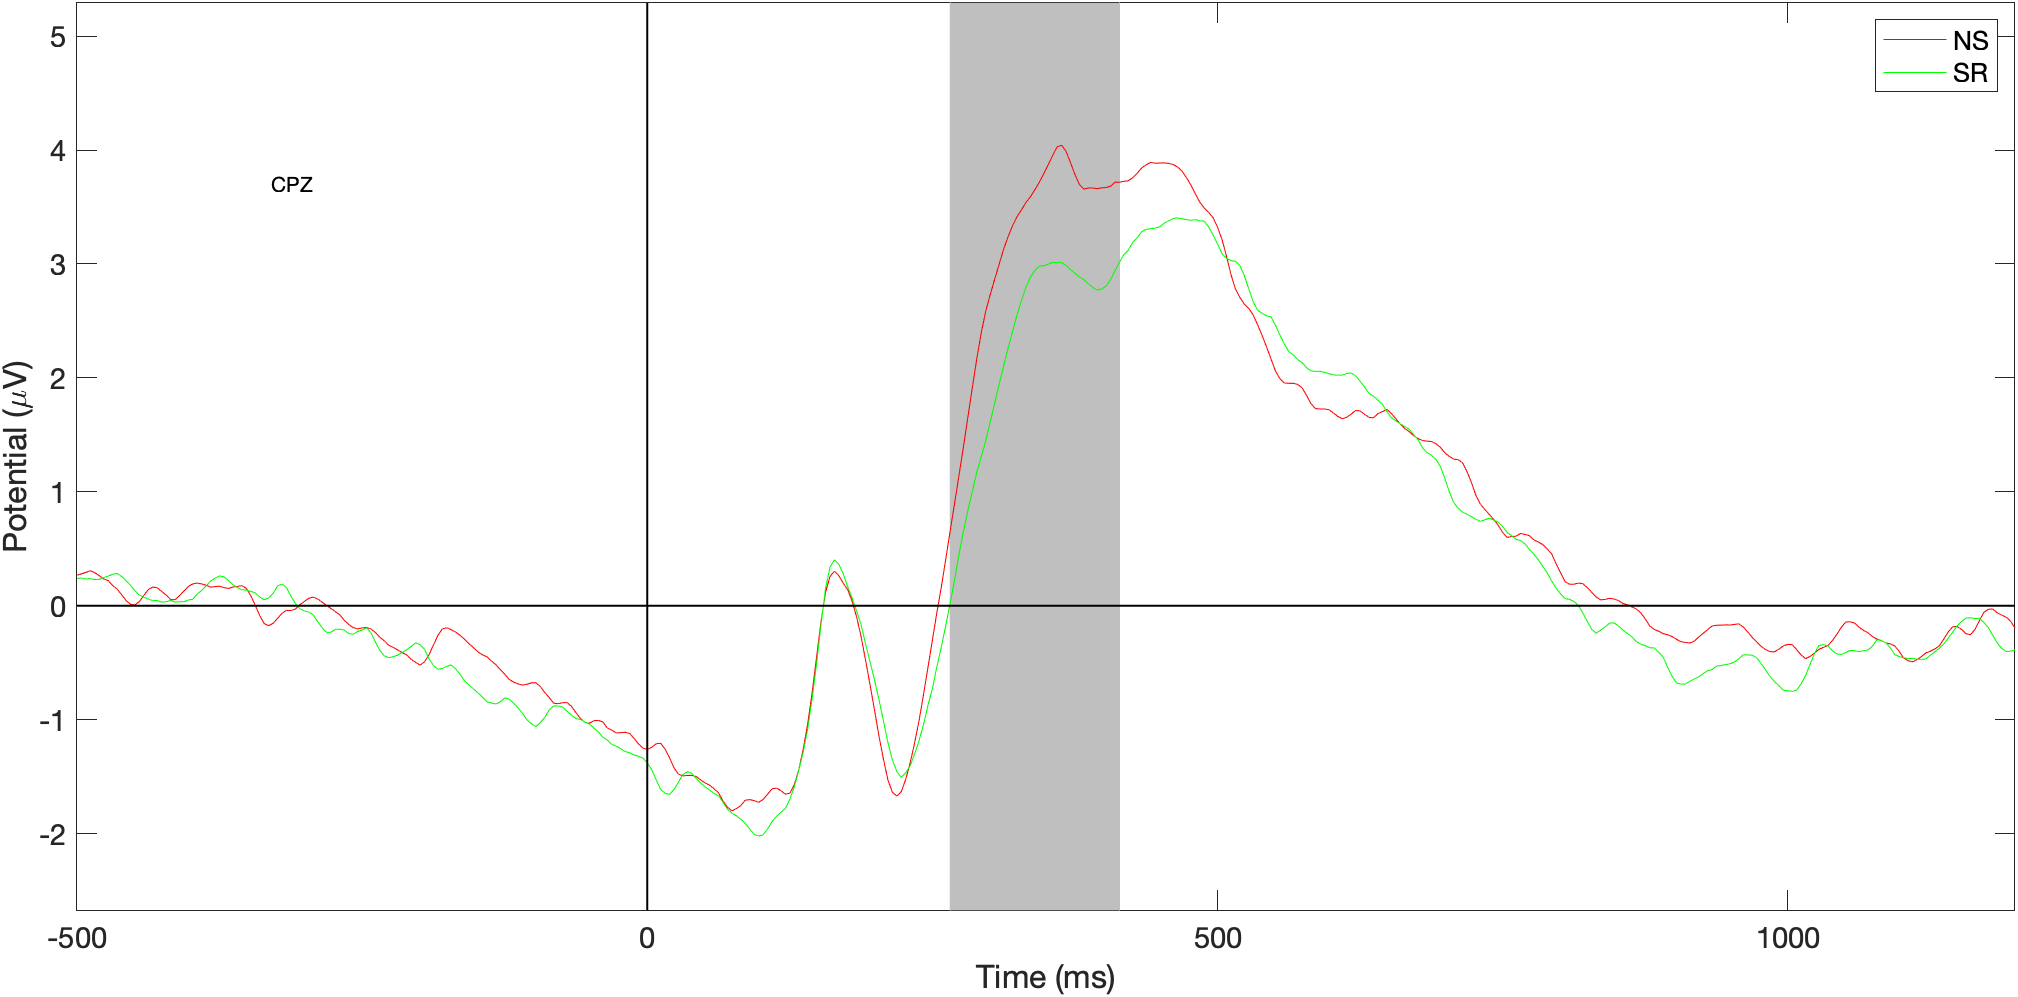
Grey bar shows statistically significant differences in amplitude at the start of P3
Source localisation - NS - SR

eLORETA Source Localisation of Current Source Density Differences (from ERP) between NS and SR
Source localisation - NS - SR
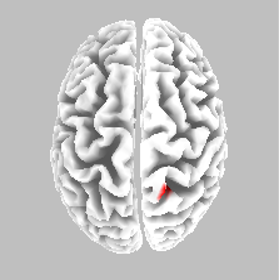
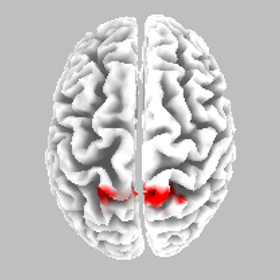
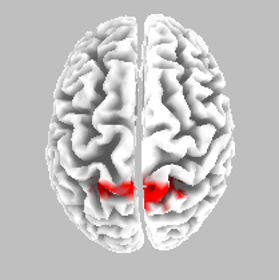
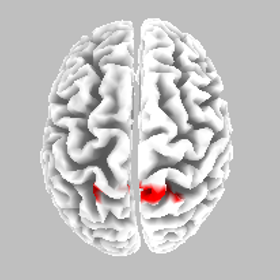
Best Match - Brodmann area 5, postcentral gyrus, parietal lobe
Somatosensory cortex - motor preparation affected?
Resting state data
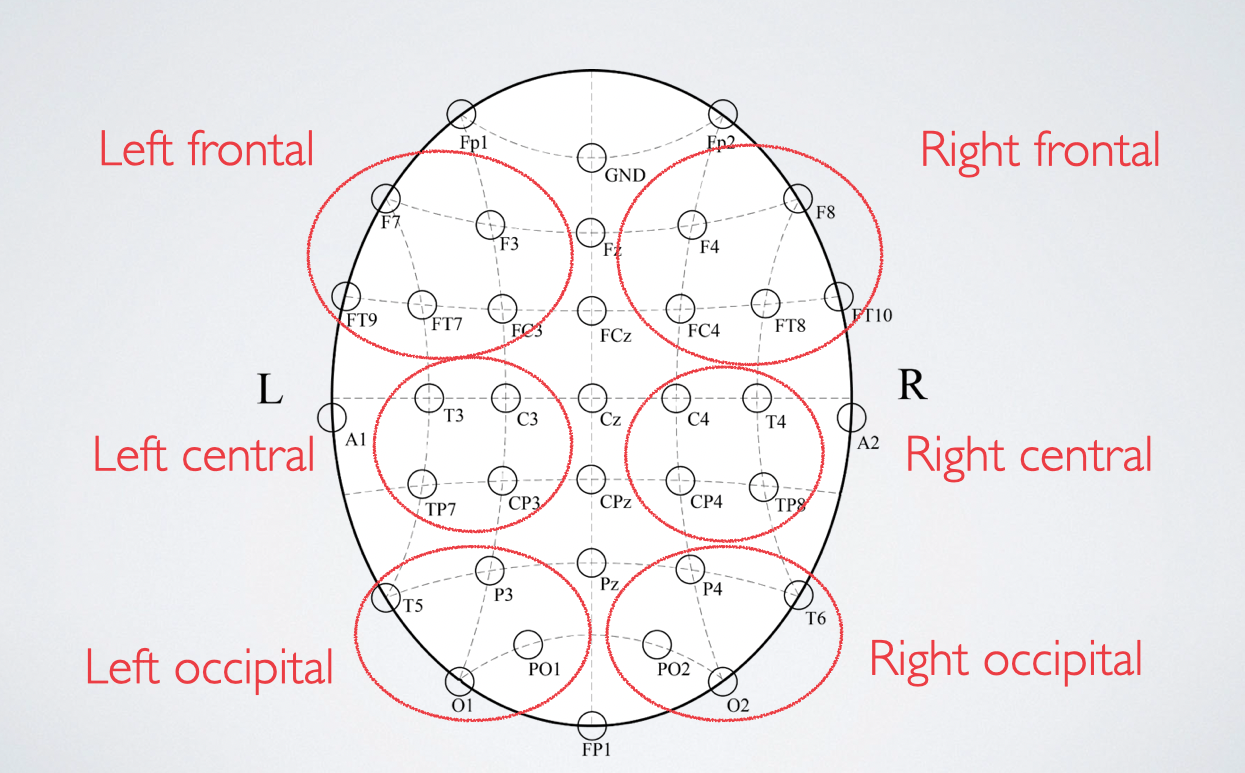
- We also measured resting state EEG (eyes open and closed)
- Divided into regions of interest (ROIs)
- L & R frontal, central, occipital
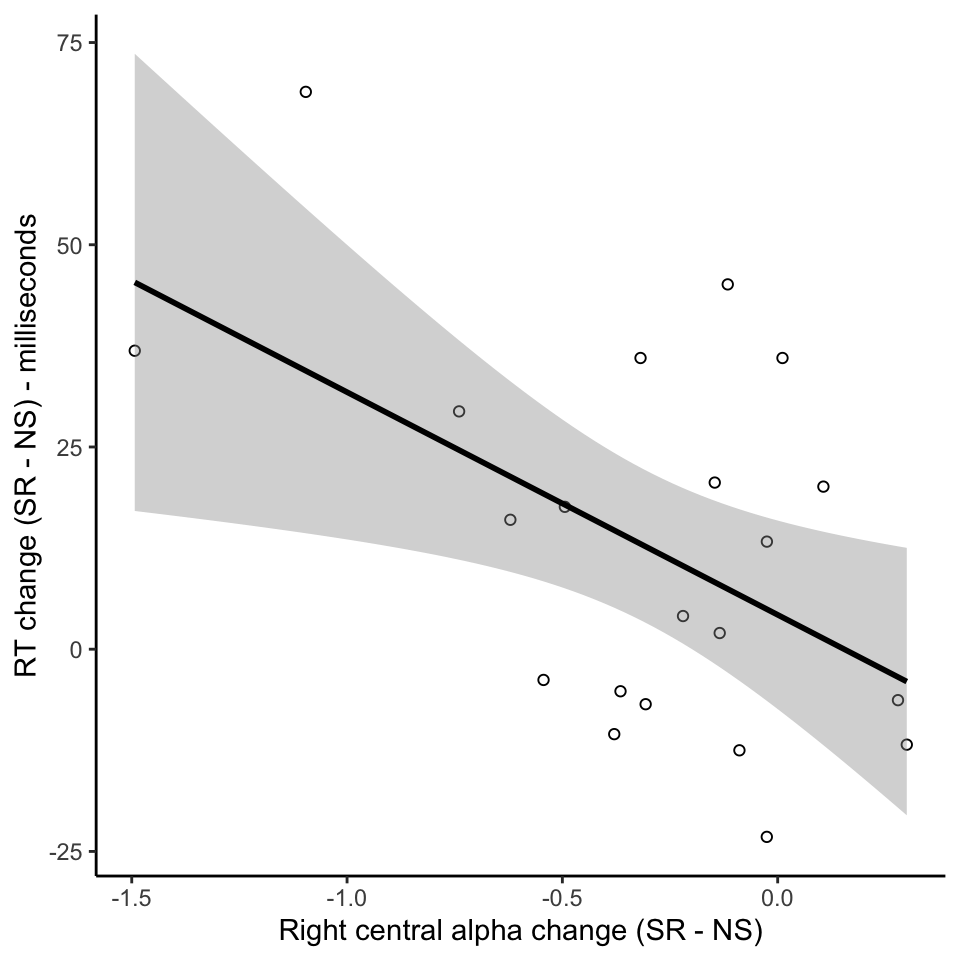
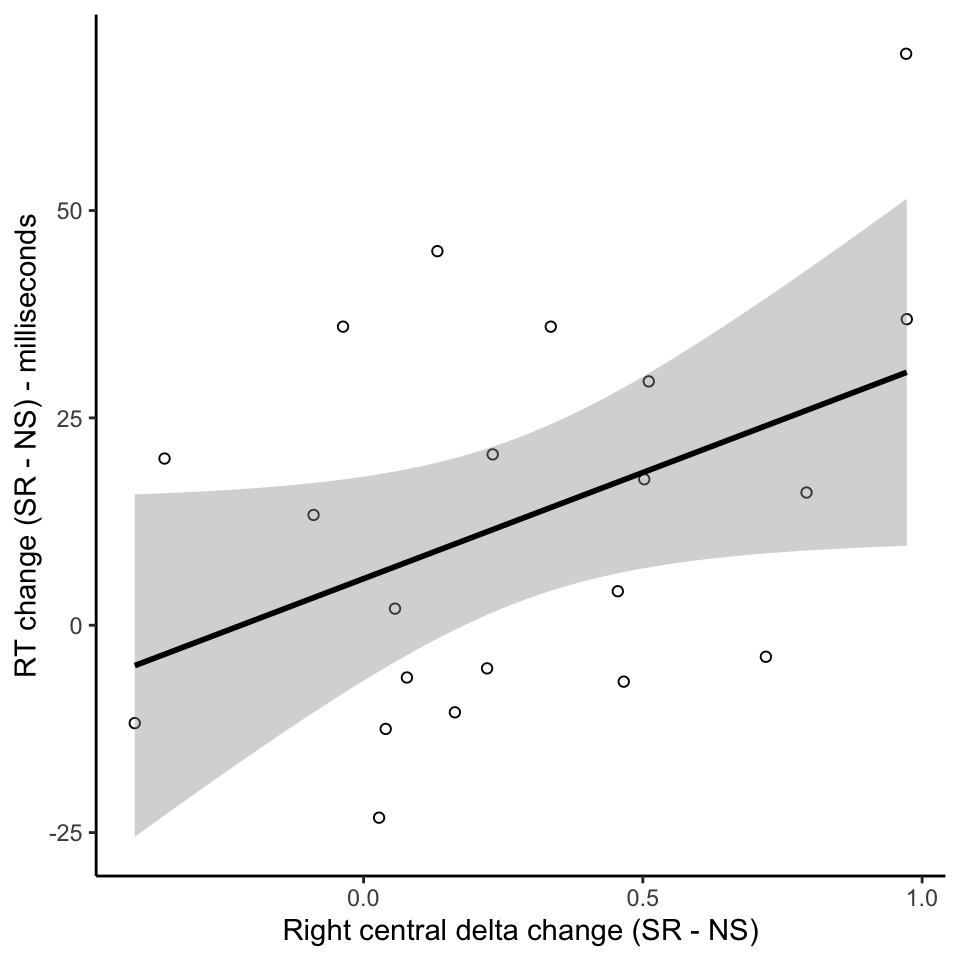
- Significant increases in alpha & decreases in delta relative frequency after sleep restriction
- Most prominent in right central ROI (C4, T4, CP4, TP8)
Resting state changes - right central ROI, eyes closed
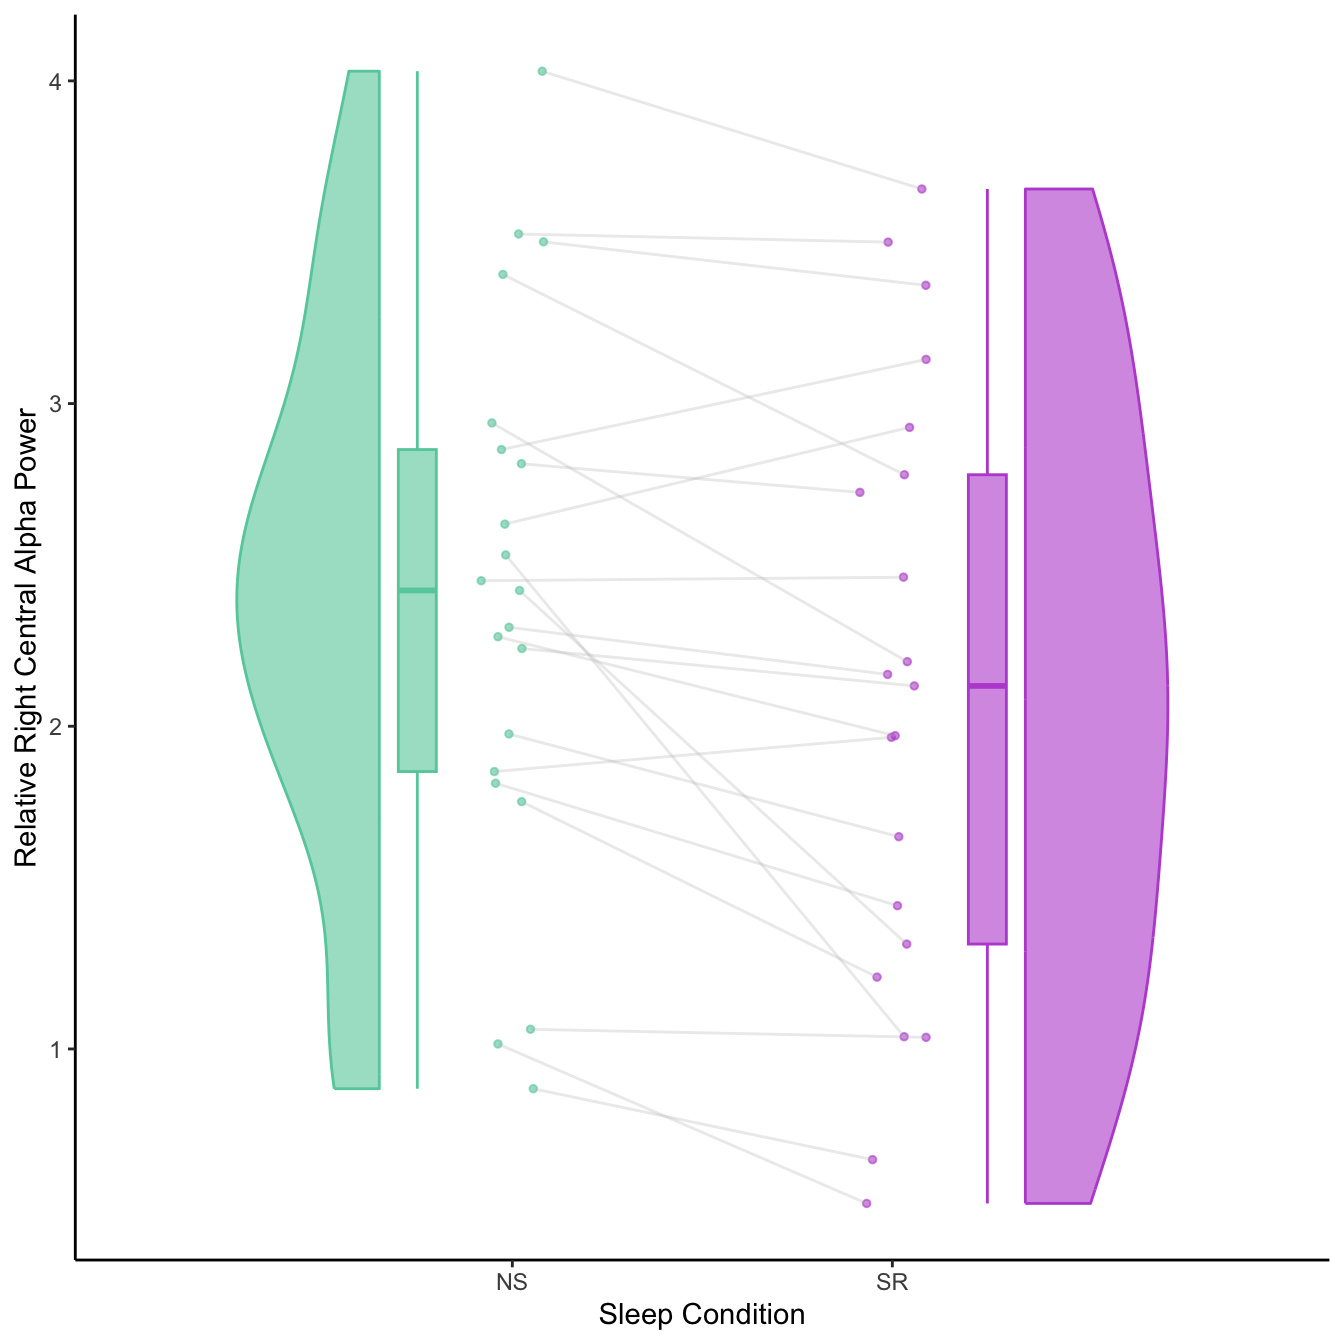
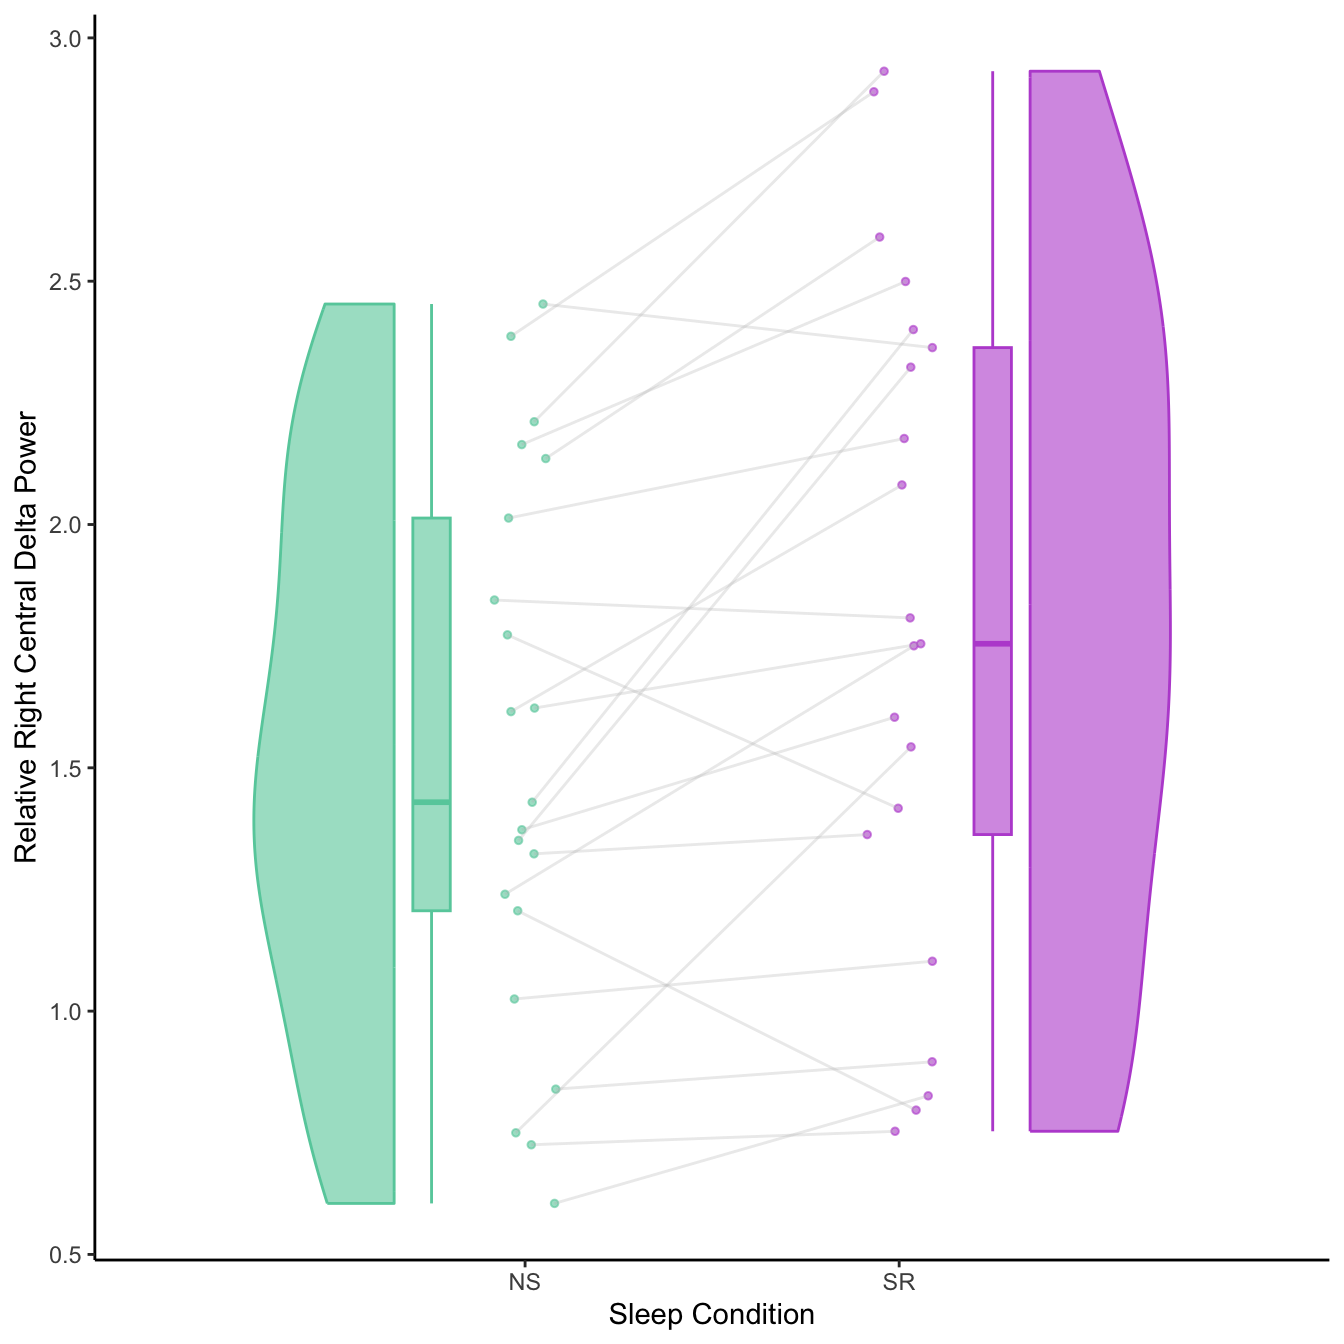
Individual variation in effects of sleep restriction